Manage Monitor Alerts
Create Monitor Alerts
You can create a new alert for your monitors. Before you start creating a new alert, please keep following things in mind:
You’ll create an alert for a source type. All the monitors of that source type will automatically fall into that alert.
You can create only 1 alert for one metric of a monitor.
If you want a different alert for same metric of specific monitors (other than what you are creating for the source type), exclude them from the alert.
If you want to create an alert for same metric of specific monitors with different conditions (that you excluded while creating the source type), include them in the alert.
To create an alert in this section click on + New button on the top panel of the screen.
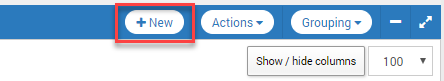
Click on New Button to Create a New Alert
A slider will open for you to provide details for the alert.
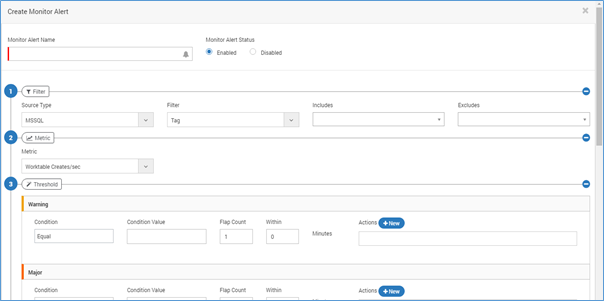
Create Monitor Alert
Monitor Alert Name: Provide the name to the monitor alert.
Monitor Alert Status: Select a status for the monitor alert.
Enabled: when selected, the alert will be active.
Disabled: When selected, the alert will be disabled.
Filter: Filters provide you only requested data out of all the data.
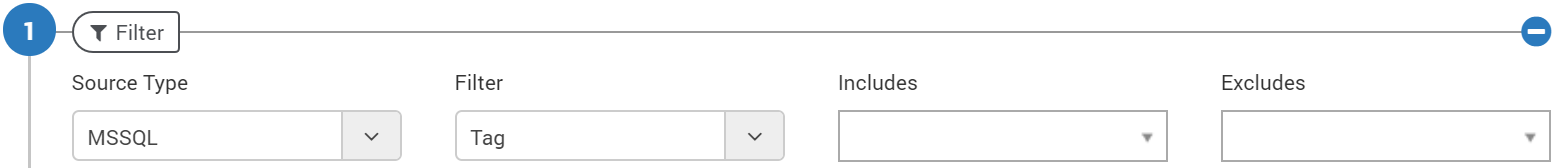
Monitor Filters
Source Type: This includes the types of the monitors that are monitored by Motadata. Selecting a source type will include all the monitors of that source by default. Note that when the source type is “Cisco Switch Port Mapper”, the alert output will show following extra columns:
VLAN Name
Interface Description
Interface Port
VLAN
Event Time
Interface Index
Filter: You may further filter the information based on:
Tag
Monitor
RPE
Department
Include: The tags, monitors, RPEs, departments associated with the source type will automatically show up in the drop down menu. You can click on the checkbox corresponding to the entity you want to include. Use this if you want to create a specific alert for a metric of any monitor.
Exclude: The tags, monitors, RPEs, departments associated with the source type will automatically show up in the drop down menu. You can click on the checkbox corresponding to the entity you want to exclude. Use this if you want to create a different alert for a metric of any monitor.
Metric: Choose the metric from the drop down on which you wish to receive the alert. If you are creating two alert for same source type with same metric, Motadata will ignore the first alert you created and only second alert will be considered.
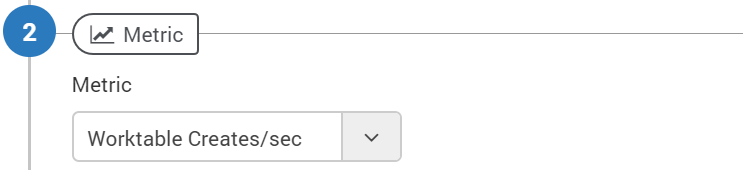
select Metrics
Threshold: Define the values and conditions for various types of alerts. For easy usage, Motadata provides 4 types of alerts.
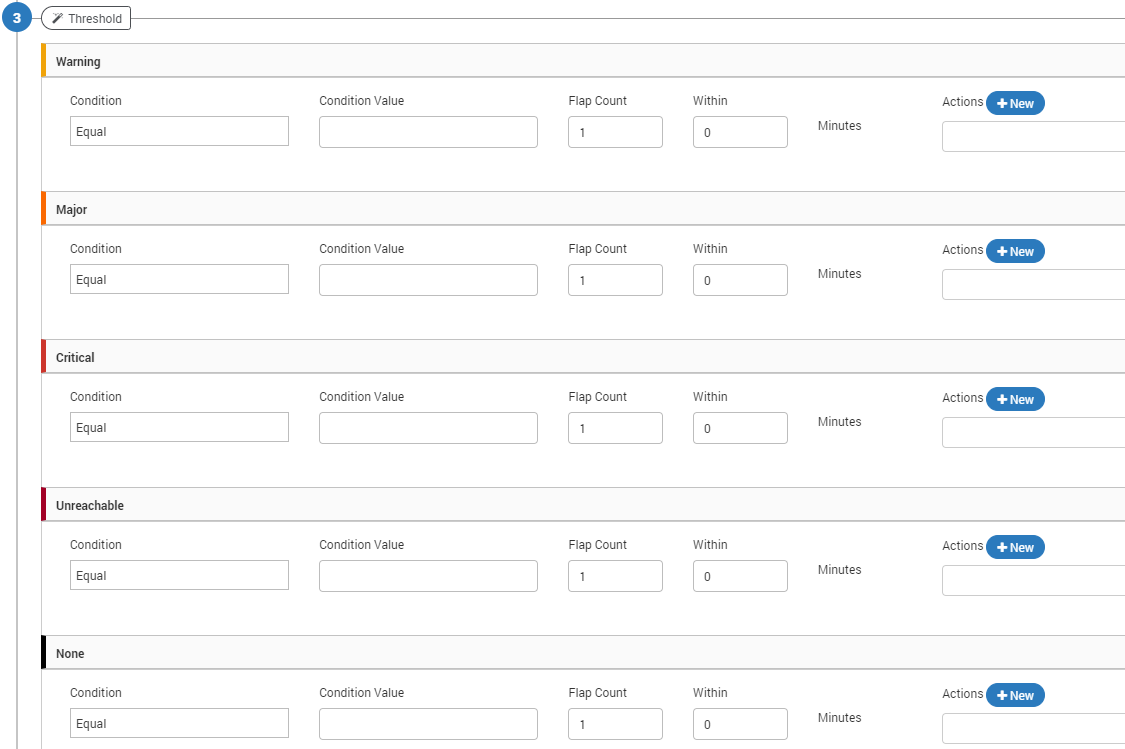
Monitor Alert Thresholds
Alert Name |
Definition of alert |
Warning |
Alert for warning will be generated. |
Major |
Alert for major will be generated. |
Critical |
Alert for critical monitor status will be generated. |
Unreachable |
Alert for unreachable monitor will be generated. |
You can write threshold conditions for each type of alert.
Condition: The condition could be any of the following – Equal/Not Equal/Greater than/Greater than or Equal/Lesser than/lesser than or Equal.
Condition Value: Here you have to define the numeric threshold value.
Flap Count: The flap count is the number of time system will wait for an alert to trigger. Suppose you set the flap count as 3 within 10 minutes. Motadata will trigger the alert (and relative action) only when then alert is triggered 4 times within 10 minutes.
Within (Minutes): Here you can define if your conditions in timely bases.
Actions: Actions are the output generated by Motadata against an alert. You can use from existing actions or create a new action. (To read more, refer to Actions<http://docs.motadata.com/user-guide/10.Actions/actions_index.html#actions> section).
Alert: Define the alert title and alert message parameters. This email will be sent to the concerned person when an alert is fired.

Select How you should be Notified
Title: Enter the subject of the email.
Message: Enter the body of the email.
List of placeholders
* $source_host$: Shows the host name of the alert source.
* $NEWLINE$: Starts the message into new line. This is for line break.
* $ip$: Shows the IP address of the monitor.
* $monitor-name$: Shows the name of the monitor.
* $alert-id$: Shows the unique alert ID value.
* $alert-name$: Shows the name of the alert.
* $alert-severity-description$: Shows the severity of the alert.
* $alert-severity-id$: Shows the unique severity ID of the alert.
* $alert-triggered-time$: Shows when the alert was triggered.
* $Status$: Shows the status of the alert.
* $monitor-host$: Shows the host name of the monitor.
Note
Leave the alert fields blank to use the Motadata’s default email template.